Power Analysis of the current New Zealand Time Trial Champion
Monday 11 November 2013, 1:16PM
By Silas Cullen
462 views
Training Smart, to become the best you can be, with the most efficient use of both time and energy is the most efficient way to improve.
It becomes even more critical if you have a limited time to train.
The old formula of riding after work based on the weather, then hammering the bunch ride in the weekend, is not as effective as it used to be.
The rules of the game are changing and so must the strategy of the “performance focussed athlete.” In the quest for constant improvement, we plan, train, race, measure and then plan again.
Through this process it is in the measuring, where the process often falls apart.
A result is one thing, but understanding “how” the result came about (what happened) is quite another.
How well you understand what made up a particular performance is the cornerstone of what happens next.
In other words the training that will be most effective based on the data you have.
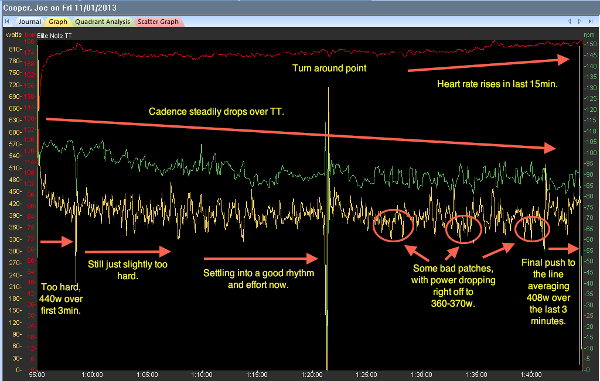
Let’s have a look at some data. The image is a file from smart coaching athlete Joe Cooper.
This is the 2013 Elite TT championships where Joe placed first in a time of 49:38s.
I will not go into the technique, endurance strength and speed aspects of what we can see in the graph.
I will look more at what actually happened.
The result was achieved (winning) but was it the perfect race?
Pacing
As you can see Joe went out a little too hard.
He averaged 440w for the first 3 minutes and 420w for the first 10 minutes.
His anaerobic threshold is around 395w, so we know he will have to recover from that effort later in the TT.
This is exactly what happened as power dropped from 415w in the first quarter of the TT to 390 in the second quarter (an error).
After the mid way turn around Joe’s pacing was a little up and down.
There were a few bad patches where he dropped right down to 360-370 as he tries to find a rhythm.
There was also a visible change in technique as Joe also started rocking a little at this point.
In the final push to the line Joe was only able to average 408w for the last 3 minutes.
This is much lower than normal and only slightly above or even at Joe’s Anaerobic threshold.
That means there was absolutely nothing left in the tank and that he was really just surviving the last part of the TT.
Cadence
The cadence has a very obvious drop over the entire TT, as Joe relied more on the strength of his legs as opposed to his cardiovascular system.
It is common to see cadence drop towards the end of a TT.
However cadence is normally much more even over the first half of a 40km TT and normally only drops in the last 5-8 minutes, in the all out effort to the line.
The graph looks like this because Joe used a slightly bigger gear to help himself recover from the initial effort at 440w which was too hard.
Heart rate
Joe’s heart rate looked very typical.
With a very slight rise in the last 15 minutes.
This could be due to slight dehydration and is often what happens in the last part of a TT, as effort increases.
But it also tells us something else.
As Joe’s cadence dropped the heart rate did not.
This means Joe was strong enough to maintain his very high work rate, even though his average cadence was only 88 (which is low for him) in the second half of the TT.
Improving the plan
There were two big factors that affected this performance that can be easily improved.
The first is the placement error mentioned above.
It came about because Joe’s training has focussed on the much shorter prologue distance of around the 10 minute mark (a higher priority) which makes perfect sense looking at the data.
So this is an easy fix in building up to a similar event if it becomes a priority to be fast over 40km.
The second factor was an issue of a new Team TT bike arriving only days before the event which did not give Joe sufficient riding on his new bike or in the new position.
From Joe’s verbal feedback and from the increase in bobbing side to side later in the ride, it had an obvious effect on technique in the latter stages of the TT.
It will also have affected Joe’s overall average sustainable wattage and time.
These two errors probably cost him around 20s each.
If we were to complete the TT again in the same conditions and with these changes (not including any other improvements we are working on).
I would predict a time in the high 48 minutes range, which is starting to get quite fast!
All in all this was a very good time trial! But there is room for improvement.
Watch this space...
Please note there is a lot more detail that can be taken out of this file which is outside the scope of this article.
The key here is to understand the importance of measuring what you are doing for the magic circle of constant improvement to be complete.
The harder you think, the faster you go!
Silas Cullen is the founder of “Smart Coaching Limited” the coaching system designed to enable maximum performance improvement for time spent training. Silas has a proven track record of giving anyone with the desire, the tools to improve without limits. For all enquiries please visit www.smartcoaching.org