TelferYoung Pass On Advice On Yield, Risk & Inflationary Tales
Tuesday 28 June 2016, 5:51PM
463 views
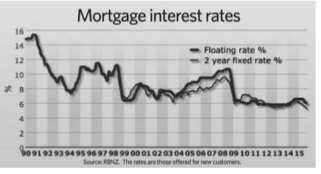
Having read a recent Associated Realty article, TelferYoung, Valuers and Property Advisors have some advice to pass on regarding what has caused yield structures to be where they now are. According to the article, this is due to factors such as extremely stimulatory mortgage interest rates, a healthy local economy and good levels of confidence. This confidence is based largely on the steady and continuous growth of the Tauranga region in population, physical size and economic development, as well as the perceived capital gains available there through investment in property. The following graph from the Reserve Bank shows the path of mortgage rates since 1990.
(See Mortgage Interest Rates Image)
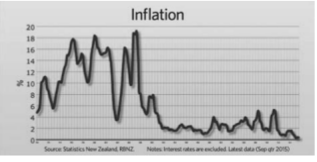
The article went on to say that, “Interest rates like other aspects of an economy tend to travel in cycles and we would be sticking our heads in the sand if we thought we weren’t in one now. But this low rate environment is also becoming embedded in our consciousness and is driving investment in property from those investors able leverage off such rates. Further, the international environment suggests little pressure from overseas for a marked upward shift in the short term. The next graph details inflation since 1970 and gives a flavour of why mortgage rates reached such giddy heights.”
(See Inflation Image)
According to the article Sir Bob Jones espouses the view that the existing lease terms and conditions (and tenant quality) within a commercial/industrial property were less important than the property’s other attributes such as location, size, design etc. If these factors were present then the leases were less important. In the period of 2008 until the first half of 2014, far more attention has been paid to the leases at a property and there has been an increasing discount for deficiencies in these factors. However, since the first half of 2014 we have once again seen an attention decrease.
At TelferYoung they will often undertake a discounted cash flow assessment of a property which will consider known or expected cash flow and expenses over what is usually a ten year time period. However, as the time horizon stretches out towards ten years, the certainty of such predictions inevitably decreases.
As a final note, TelferYoung have sourced information on generic yield structures across the entire country. The following table shows these yield structures for Tauranga and some selected areas elsewhere in New Zealand.
Tauranga 5.5% to 7.5%
Rotorua 7.5% to 9%
Hamilton 6.5% to 8.25%
Please note that these ranges take out the extreme highs and lows. The table does though illustrate that Tauranga is a region where the income return on property investment is squeezed tighter than in other areas. The relationship between their yield structures and those of their provincial neighbours has remained similar to this since the late 1990s.
For more information on TelferYoung and their property valuation services, please go to https://www.telferyoung.com