Annual Residents Survey 2012 – How is Council Performing?
75% of residents surveyed said they are satisfied with how Council spends rates on the services and facilities it provides.
Since 1996, Council has regularly commissioned a survey of Tasman residents to get their views on a range of the services it delivers. For the last four years these surveys have been done every year.
A total of 400 residents over 18 years of age are surveyed, with interviews conducted spread across the five wards and across various age brackets to ensure a representative sample.
The results from the survey cover satisfaction levels with Council services and compares these against results for similar size local authorities around New Zealand to get a feel for how the Council is performing.
The results are used to gauge the opinions of the District as a whole and are also broken down across the wards.
Commenting on the survey findings Mayor Richard Kempthorne said, “I always look forward to receiving the results of the Council’s annual survey – it’s vitally important that we understand where residents feel Council is performing well, and where it needs to improve.
"My focus is on the Council providing the core services to an acceptable level whilst keeping rates affordable; the direct feedback provided by the survey enables the Council to gauge how we are performing against this goal. Overall 36% of residents think Tasman is a better place to live today than it was three years ago, with only 6% saying it is worse.
"I take a lot of encouragement from this. Yes, there will always be issues that people feel could and should be improved, but if respondents feel the District is developing well then I am confident we are on the right track.”
A summary of the 2012 survey’s findings can be found below. The full survey results can be viewed at www.tasman.govt.nz/link/resident-survey
The independent residents survey was conducted by the National Research Bureau for Council during May/June 2012.
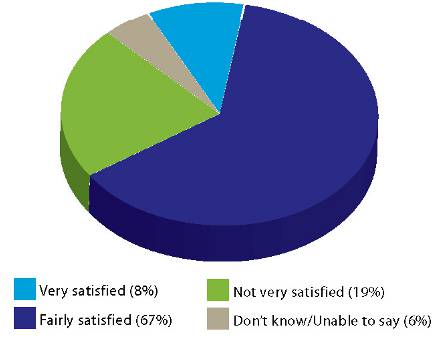
Rates Issues
Overall, 75% of Tasman District residents are ‘very satisfied’ or ‘fairly satisfied’ with the way rates are spent on services and facilities provided by Council, 19% are not very satisfied. This is a slight improvement on 2011 figures.
See Pie Graph
Contact with Council
Residents are most likely to contact Council offices or staff (79%) first if they have a matter to raise with Council while 7% would make contact with a Councillor. These are similar to the 2011 figures.
Of the residents who had contacted Council in the last 12 months, 82% were satisfied with the service they received, 17% were not very satisfied. This is an improvement on 2011 figures.
Seen, Read or Heard Information from Council
95% of residents say they have seen, read or heard information from the Council in the last 12 months in the form of:
| Newsline – The Mag | 95% (95% in 2011) |
| Council advertisements in newspapers | 70% (66% in 2011) |
| Information available from Council offices or libraries |
37% (40% in 2011) |
| The Annual Plan | 48% (40% in 2011) |
| Long-Term Plan | 51% (42% in 2011) |
| Council advertisements on the radio | 36% (35% in 2011) |
Sufficiency of Information Supplied by Council
83% of residents feel that there is enough or more than enough information supplied by Council while 13% feel there is not enough or nowhere near enough information supplied.
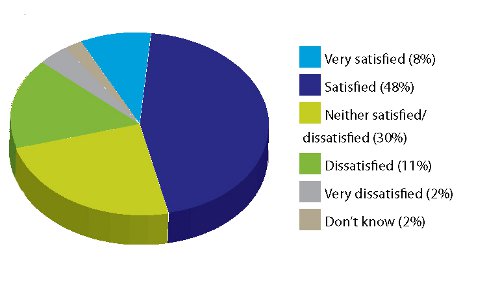
Council Consultation and Community Involvement
Satisfaction with the way Council consults the public in the decisions it makes.
See Pie Graph
Frequency of Use – Council Services and Facilities
Recreational facilities (86%) and Council’s kerbside recycling service (82%) are the facilities or services surveyed which have been most frequently used by residents or members of their households in the last year. Public libraries (81%) and public toilets (70%) were also widely used.
Local issues – Internet Access
87% of residents say they have access to the Internet.
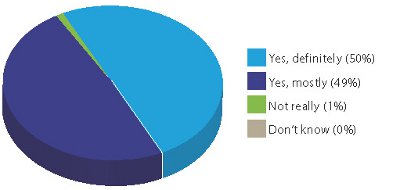
Perception of Safety
Is Tasman District generally a safe place to live?
See Pie Graph
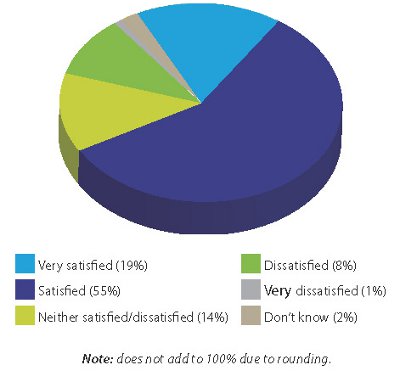
Natural Environment
Satisfaction that the natural environment in the Tasman District is being preserved and sustained for future generations.
See Pie Graph
About the Survey
This NRB Communitrak survey was conducted with 400 residents of the Tasman District and was framed on the basis of the wards. All interviews were conducted on the telephone. The survey has a margin of error of plus or minus 4%. Figures do not always add up to 100% due to rounding.