Household saving negative but improving
Household expenditure continues to outpace income, with New Zealanders showing a steady preference for investment in the property market, according to new saving statistics released today by Statistics New Zealand.
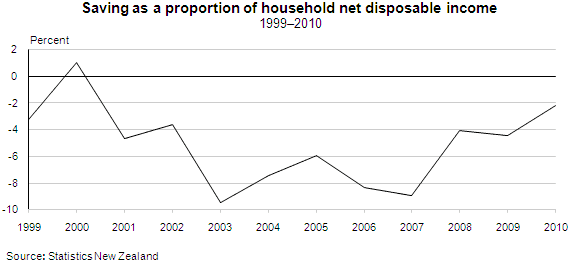
The household saving rate, expressed as a percentage of household net disposable income, has been mostly negative since 1999 but has improved in recent years, reaching negative 2.2 percent in the year ended March 2010. Household saving is calculated by subtracting expenditure from income received through salaries, wages, interest, and dividends.
"While improvements in the saving rate in recent years were due to rising salaries and wages, and farming income, the improvement in 2010 was mainly due to less income tax paid arising from decreases in personal tax rates effective from 1 Oct 2008,” economic statistics development manager Jude Hughes said.
From 1999 to 2008, New Zealanders continued to invest mainly in property, particularly in residential buildings. Mortgage interest paid also increased during this period. The official cash rate peaked at 8.25 percent in July 2007.
The government saving rate was negative in 2010, the first time in 17 years. This fall was due to lower income as a result of reduced personal tax rates and reduced resident withholding tax. In addition, social assistance benefits paid have increased from 2008 to 2010, consistent with the rise in the unemployment rate from a 21-year low of 3.7 percent to 6.4 percent for the year ended March 2010.
National saving, which is the sum of all the sectors in the economy, increased to $3.2 billion in the year ended March 2010 and is down from its peak ($7.9 billion) in 2004.
This is the first release of the official institutional sector accounts (1999–2008) for all sectors of the economy. Information contained within the accounts can be used to study the source and disposal of incomes, the origin of saving, the direction and method of transfer of saving from one sector to another, and the areas of the economy in which available funds are spent. Official accounts for the household and general government sectors are included to 2010.
Highlights
This is the first release of official institutional sector accounts (ISA) for the years ended March 1999 to 2008 for all sectors. The ISA analyse income, saving, and other transactions by economic sector. For the years ended March 1999–2008:
- National saving rose to a peak of $7.9 billion in 2004, and then decreased to $4.1 billion by 2008.
- Dissaving by the household sector increased from 3.2 percent of household net disposable income in 1999 to 8.9 percent in 2007, then shrank to 4.0 percent in 2008.
- Central government sector saving increased from 5.8 percent of net disposable income in 1999 to 26.1 percent in 2008.
- Interest received in the finance sector almost tripled, from $13.7 billion in 1999 to $39.5 billion in 2008.
Accounts for the general government and household sectors contained in this release are published up to and including the year ended March 2010. For the year ended March 2010:
- National saving decreased to $7.0 million in 2009 but rose to $3.2 billion in 2010.
- Dissaving by households increased again to 4.5 percent of household net disposable income in 2009 then shrank to 2.2 percent in 2010.
- Central government sector saving decreased from 12.6 percent of net disposable income in 2009 to -3.9 percent in 2010.