London 2012 Paralympics: Medal strike rate

Available files
New Zealand tops alternative overall medal count for the Paralympics
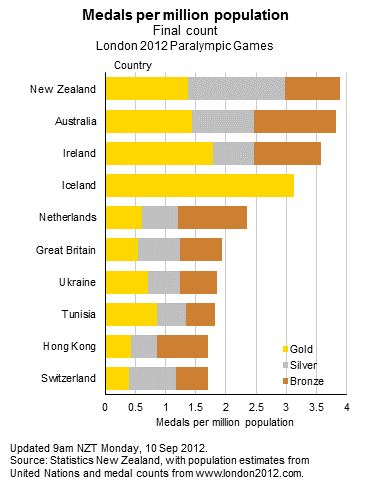
The performance of our medal winning athletes at the Paralympics in London means New Zealand has finished top of Statistics New Zealand's table based on overall medals per head of population.
New Zealand won 17 medals at the Paralympics, spearheaded by six from swimmer Sophie Pascoe, another four from fellow swimmer Mary Fisher, and three from cyclist Phillipa Gray and her pilot Laura Thompson.
On a traditional medal table ranked by gold, then silver and bronze medals, the results saw New Zealand finish 21st. However, using Statistics NZ's calculation of medals per million people in each country, New Zealand finished top, with 3.89 medals per million of population.
Australia was second with 3.85 medals per million.
On the traditional Paralympics table, China finished top with 231 medals including 95 gold. On Statistics NZ's population table, China was 55th, with 0.17 medals per million, for its population of 1.34 billion.
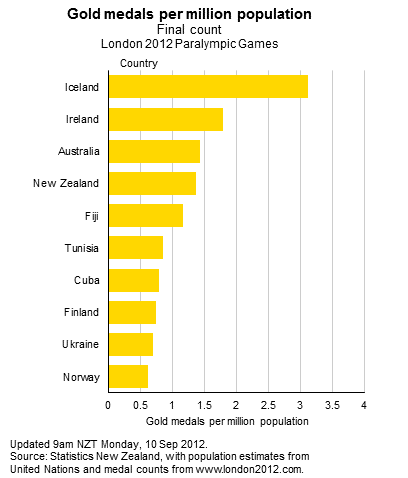
Ranking by only gold medals per million of population, New Zealand finished fourth, with 1.37 gold medals per million. Iceland topped that table. It won just one gold medal, but with only 320,000 people in the country, that meant 3.12 gold medals per million.
China finished 47th on Statistics NZ's gold medal table.
The results compare favourably to New Zealand's Olympic efforts. On total medals, New Zealand ended fourth on overall medals on the population-based table at the Olympics, but top at the Paralympics.
For gold medals, New Zealand also finished fourth on the population-based table at the Olympics, matching the fourth for the Paralympics.
|
Gold medal count, per million population final count, London 2012 Paralympic Games |
||||||||
| Gold per million population |
Actual number won |
|||||||
| Rank |
Number |
Country |
Total population (million) |
Gold |
Silver |
Bronze |
Total |
|
|
1 |
3.12 |
Iceland |
0.32 |
1 |
0 |
0 |
1 |
|
|
2 |
1.79 |
Ireland |
4.47 |
8 |
3 |
5 |
16 |
|
|
3 |
1.44 |
Australia |
22.27 |
32 |
23 |
30 |
85 |
|
|
4 |
1.37 |
New Zealand |
4.37 |
6 |
7 |
4 |
17 |
|
|
5 |
1.16 |
Fiji | 0.86 |
1 |
0 |
0 |
1 |
|
|
6 |
0.86 |
Tunisia | 10.48 |
9 |
5 |
5 |
19 |
|
|
7 |
0.80 |
Cuba | 11.26 |
9 |
5 |
3 |
17 |
|
|
8 |
0.75 |
Finland | 5.36 |
4 |
1 |
1 |
6 |
|
|
9 |
0.70 |
Ukraine | 45.45 |
32 |
24 |
28 |
84 |
|
|
10 |
0.61 |
Norway |
4.88 |
3 |
2 |
3 |
8 |
|
|
Medal count, per million population, final count, London 2012 Paralympic Games |
||||||||
|
Total medals per million population |
Actual number won |
|||||||
| Rank | Number |
Country |
Total population (million) |
Gold |
Silver |
Bronze |
Total |
|
| 1 | 3.89 |
New Zealand |
4.37 |
6 | 7 | 4 | 17 | |
|
2 |
3.82 |
Australia |
22.27 |
32 |
23 |
30 |
85 |
|
|
3 |
3.58 |
Ireland | 4.47 |
8 |
3 |
5 |
16 |
|
|
4 |
3.12 |
Iceland |
0.32 |
1 |
0 |
0 |
1 |
|
|
5 |
2.35 |
Netherlands |
16.61 |
10 |
10 |
19 |
39 |
|
|
6 |
1.93 |
|
Great Britain | 62.04 |
34 |
43 |
43 |
120 |
|
7 |
1.85 |
Ukraine | 45.45 |
32 |
24 |
28 |
84 |
|
|
8 |
1.81 |
Tunisia |
10.48 |
9 |
5 |
5 |
19 |
|
|
9 |
1.70 |
Hong Kong |
7.05 |
3 |
3 |
6 |
12 |
|
|
10 |
1.70 |
Switzerland |
7.66 |
3 |
6 |
4 |
13 |
|