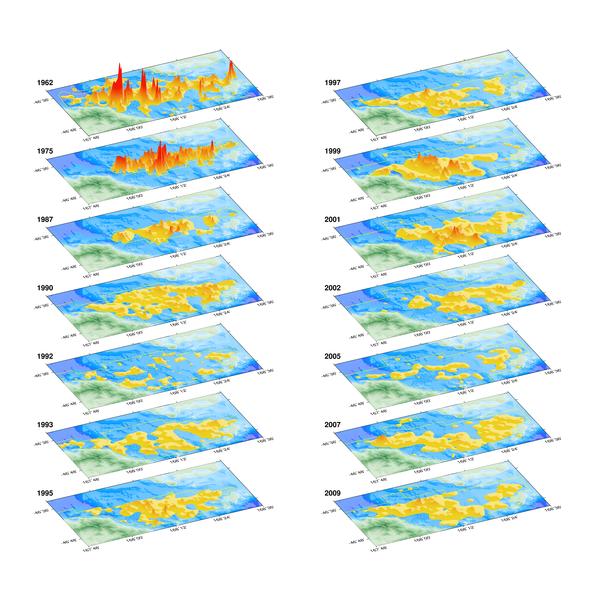
Disease mortality of the fishery over 25 years
Credit: NIWA

This graphics shows the disease mortality over the last 25 years:
1. It shows that the disease drives the fishery,
2. the fishery recovers from mortality,
3. that oysters rebuild in the same areas,
4. there was a disease event in 1985-92,
5. 2002-2005 was a low point in the fishery.