Off the sheep's back: a look at historical wool export prices and volumes
In 2011, wool export prices rose sharply to a 21-year high and sheepmeat export prices reached an all-time high. This reminds us of the historical importance of wool and sheep farming to the New Zealand economy.
Wool was New Zealand’s main export earner from the 1850s until the start of the 20th century (Te Ara – the Encyclopedia of New Zealand, 2009). In 1920, wool contributed 26 percent of the the total value of exports, but by 2011 wool's contribution to the value of exports had fallen to 1.6 percent.
The number of sheep peaked at 70.3 million in 1982. However, an end to government subsidies in 1984 (Federated Farmers, 2002) and greater use of synthetic fibres hastened a decline in the relative importance of wool. Since then, farmers have shifted their focus to sheepmeat production as export prices improved relative to those of wool and total exports, or have converted to dairy farming.
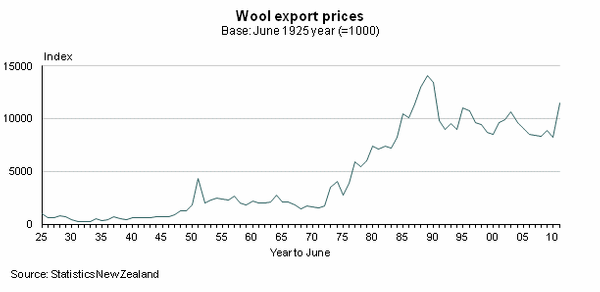
Wool prices from 1925 to 1989
For this article, wool exports cover greasy and degreased wool but exclude wool yarn and wool fabric. (Wool is degreased by scouring, which involves washing the shorn wool to remove contaminants.) Historically, there were two periods of rapid export price gains for wool. Figure 1 shows that wool export prices rose strongly in 1951, during the Korean War, and between 1971 and 1989, when general price inflation was relatively high.
Figure 1 Wool export prices (see chart)
In 1951, wool prices spiked when the United States military ordered large quantities of wool products during the winter campaign of the Korean War. This led to a wool boom, with prices for wool exports rising 130 percent between 1950 and 1951. However, they did not remain at this higher level, and within a year prices had fallen (down 53 percent) to similar levels seen in 1950.
Wool export prices rose again between 1971 and 1989 – by more than 800 percent. However, this rise coincided with high general price inflation, with total export prices increasing nearly 600 percent. This means that wool export prices rose, relative to total export prices, by 33 percent between 1971 and 1989.
Wool prices in recent times – from 1989 to 2011
Wool prices peaked in 1989, then declined after a global slowdown in 1990. The economic downturn associated with the dissolution of the former Soviet Union in 1991 also had a downward influence on wool prices, as the Soviet Union was one of the world’s major consumers of wool (Australian Bureau of Agricultural and Resource Economics, 2000).
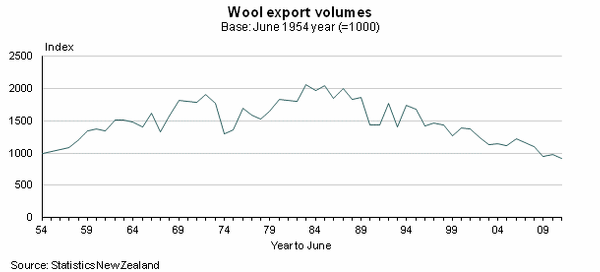
During the 1990s, the wool industry faced competition from growth in the use of synthetic fibres and changing consumer tastes. Traditionally, New Zealand had exported mainly coarse wool for making carpet, but this market was also under pressure from synthetic carpets. As figure 2 shows, the volume of New Zealand’s wool exports fell about 50 percent between 1989 and 2011.
Figure 2 Wool export volumes (see chart)
Since 1989, as figure 1 shows, prices have been cyclical, with smaller peaks in 1995 and 2003, and most recently in 2011. Demand from China influenced the latest increase in wool prices, which rose 39 percent between 2010 and 2011.
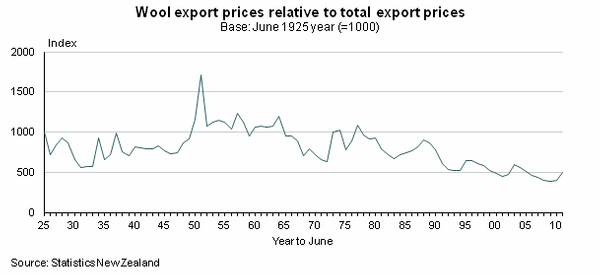
Wool export prices fell 42 percent, relative to total export prices, from 1989 to 2011 (see figure 3). Figure 3 also shows that, between 1925 and 2011, wool export prices were at the highest, relative to total export prices, in 1951 when prices spiked during the Korean War.
Figure 3 Wool export prices relative to total export prices
The shift in emphasis from wool to sheepmeat
Historically, wool was the main sheep-related export commodity. More recently, the emphasis has shifted more towards sheepmeat, particularly lamb.
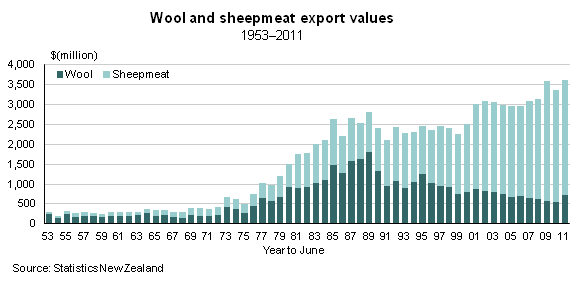
When wool prices peaked in 1989, the total export value of New Zealand’s wool was $1.8 billion (see figure 4). By 2011 this had fallen 60 percent, to $720 million. In contrast, lamb, hogget, and mutton exports rose 189 percent over the same period, up from $1.0 billion in 1989 to $2.9 billion in 2011.
Figure 4 Wool and sheepmeat export values (see chart)
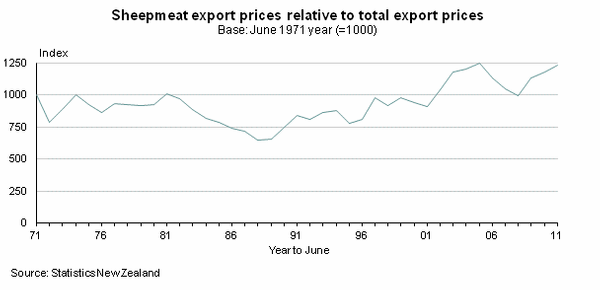
Since 1989, sheepmeat prices have been trending upwards relative to export prices overall (see figure 5), bringing better returns for sheep farmers. Wool prices have trended downwards over the same period.
Figure 5 Sheepmeat export prices relative to total export prices (see chart)
Sheep numbers peak in the 1980s
Sheep numbers, which include ewes, ewe hoggets, wethers, and rams, have fallen over the 30 years to 2011. Contributing factors include government subsidies being removed in 1984, declining real wool prices, and better returns from dairy farming – which in part contributed to some farmers switching from sheep to dairy.
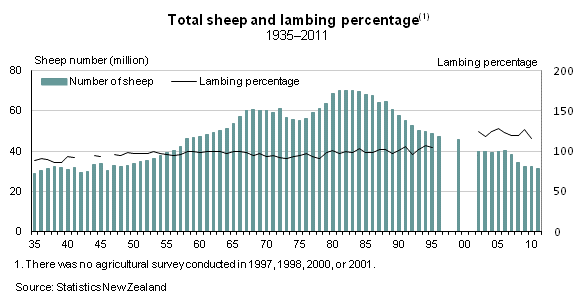
Figure 6 shows that, according to the Agricultural Production Survey, the total number of sheep peaked at 70.3 million in 1982, but had fallen 56 percent (to 31.1 million) by 2011. The last time the number of sheep was at this level was in the mid 1940s. From 1982 to 2011, the number of dairy cattle increased from 3.0 million to 6.2 million – up 105 percent.
When government subsidies for sheep farmers were abolished in 1984, large areas of hill country became uneconomic to farm.
Figure 6 Total sheep and lambing percentage (see chart)
Productivity gains for lambing
Sheep farming has become more productive. Technological and scientific advances have helped to improve returns for farmers as, for example, the quality of pasture has improved. Fewer ewes are now needed to produce the same volume of lamb meat. In 1989, the lambing percentage was 102 percent (the percentage of lambs produced in the current year compared with the number of ewes put to ram in the previous year). By 2011, this figure had reached 116 percent.
Lambs have also become heavier. According to Beef and Lamb New Zealand, the average export lamb slaughter weight was 12.7 kg in the year to September 1989. In the year to September 2011, the average weight was 18.4 kg, an increase of 44 percent.
Increases in the lambing percentage and in the size of lambs produced have offset the fall in the number of sheep. Sheepmeat export volumes, which include lamb, hogget, and mutton, rose 9.6 percent between 1989 and 2011.
Conclusion
Wool has been a less important export earner for New Zealand since the 1990s. As a percentage of total exports, wool fell from 26 percent in 1920 to 1.6 percent in 2011. Sheep farmers have switched their focus from wool to sheepmeat as meat prices have risen, relative to total export prices, and wool prices have fallen.
Sheep numbers have declined since their peak in the 1980s. Contributing factors include government subsidies being removed in 1984 and increasing returns for dairy products.
Improvements on the farm have affected sheep farming. Lambing percentages have increased and lambs have become bigger, meaning that fewer ewes are now needed to produce the same volume of meat. This has contributed to a rise in the volume of sheepmeat exports, despite falls in sheep and lamb numbers.
Wool at a glance gives a pictorial summary of how wool and sheepmeat exports have fared over the 50 years to 2010.
References
Federated Farmers of New Zealand (2002). Life after subsidies, the New Zealand farming experience – 15 years later
Australian Bureau of Agricultural and Resource Economics (2000). Demand for wool in a changing world. Australian Commodities 7(3) September quarter. Available from www.abare.gov.au
Te Ara – the Encyclopedia of New Zealand (updated 1 March 2009). Meat and Wool. Available from www.teara.govt.nz