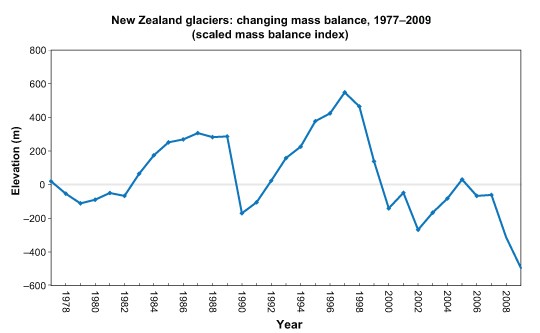
This graph shows how the "mass balance" of 50 glaciers in New Zealand's Southern Alps has changed since 1977.
Credit: Jordy Hendrikx, NIWA

This graph shows how the "mass balance" of 50 glaciers in New Zealand's Southern Alps has changed since 1977. The mass balance drops if less snow falls and/or if more snow melts. When analysing the effect of the end-of-summer snowlines, a negative mass balance year has almost twice the impact of a positive mass balance year of the same magnitude; i.e., when one portion of snow melts, it takes about two equivalent portions of snow fall to keep a glacier's mass balance the same. Despite this, most of the observed shrinkage of NZ glaciers in response to global warming is not related only to the drop in mass balance shown here, but due to ice melting in the trunk of the major eastern glaciers ("down-wasting") and chunks of ice falling off into lakes at the foot of the glaciers ("ice calving").